|
SHARETIPSINFO >>Research Reports >> RALLIS INDIA (25-02-2009)
LISTING |
|
|
Rs 368 |
|
Rs621/Rs275 |
|
Rs10 |
PE |
3.45 |
DIV YIELD |
4.38 |
COMPANY OVERVIEW:
The Company was incorporated on 23rd August, at Calcutta. The Company manufacture and sell pharmaceuticals, super phosphate, fertilizer mixtures, pesticides, hydrosulphite of soda, electric fans, petrol fans, petrol engines and garments and also to trade in fertilizer, cotton, tanning materials, piece goods, textiles, crushed bones and marine products. The Company had distribution arrangements for single and compound fertilizers, electric fans, stationary and portable machine tools, electrical appliances, power sprayers, pharmaceuticals, chemicals, and household products.
Rallis India became the part of TATA group in 1997. The company is the largest agro company and second largest seed producer in India.
Product Mix:
Product Name |
Sales Value |
% of Total Sales |
1.Pesticides |
704.02 crore |
94.22 |
2.Seeds |
16.26 crore |
2.17 |
3.Plant Growth Nutrients |
12.32 crore |
1.64 |
4.Tanning Material |
7.05 crore |
0.94 |
5.Scrap |
6.4 crore |
0.85 |
6.Commissions |
1.14 crore |
0.15 |
DISHA AND APOLLO –CHANGED THE PROFILE OF THE COMPANY:
DISHA (Driving Innovative Solution for Hyper Achievements) is an initiative for improving operational efficiency. The company has already worked on the first wave of DISHA which comprises of improving efficiency in manufacturing, procurement and utility while second wave has just begun mainly targeted towards functions like sales, finance and logistics. The third wave will be to control the overheads.
APOLLO is the initiative to have a rational approach towards entering into international market. We believe that share of export to sales of 22% is lower as compared to peers. With APOLLO Company will be able to achieve a target of 40% of export as of total sales. The increase in international market will reduce its dependence on the Indian market which is more dependent on the monsoon.
SHAREHOLDING PATTERN:
|
|
NO.OF SHARES |
% OF TOTAL SHARE |
PROMOTER |
5417387 |
|
45.20% |
|
INSTITUTION |
3738832 |
|
31.20% |
|
GENERAL PUBLIC |
2828374 |
|
23.60% |
|
GRAND TOTAL |
11984593 |
|
100% |
|
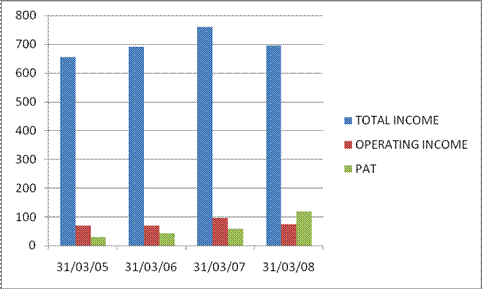
FINANCIAL:
|
|
31/03/05 |
31/03/06 |
31/03/07 |
31/03/08 |
TOTAL INCOME |
656.19 |
691.75 |
760.58 |
694.89 |
EXPENDITURE |
-587.44 |
-622.05 |
-663.68 |
-620.3 |
OPERATING INCOME |
68.75 |
69.7 |
96.9 |
74.59 |
DEPRECIATION |
-16.11 |
-16.75 |
-31 |
-15.07 |
PBIT |
|
52.64 |
52.95 |
65.9 |
59.52 |
INTEREST |
|
-23.09 |
-8.41 |
-10.89 |
-3.66 |
PBT |
|
29.55 |
44.54 |
55.01 |
55.86 |
TAX |
|
-0.68 |
-2.01 |
3.1 |
-20.98 |
EXTRA ORD INCOME |
|
|
|
82.38 |
PAT |
|
28.87 |
42.53 |
58.11 |
117.26 |
CHANGE IN TOTAL INCOME, OPERATING INCOME AND NET PROFIT:
KEY HIGHLIGHTS:
CAGR IN NET SALES OVER 4 YEAR PERIOD IS 2%.
CAGR IN OPERATING PROFIT OVER 4 YEAR PERIOD IS 2.75%.
CAGR IN NET PROFIT OVER 4 YEAR PERIOD IS 59.55%.
RATIOS:
|
|
31/03/05 |
31/03/06 |
31/03/07 |
31/03/08 |
|
EPS |
24.05833 |
35.44167 |
48.425 |
97.71667 |
|
OPM |
10.47715 |
10.07589 |
12.74028 |
10.73407 |
|
NPM |
4.39964 |
6.148175 |
7.640222 |
16.87461 |
INTEREST COVERAGE |
2.279775 |
6.296076 |
6.051423 |
16.2623 |
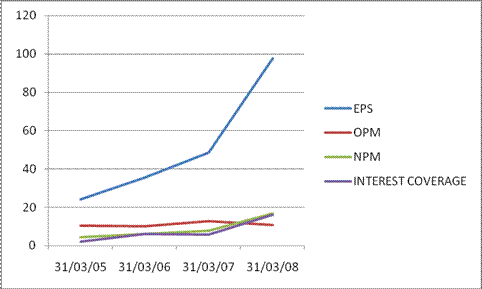
KEY HIGHLIGHTS:
EPS HAS SHOWN A GROWTH OF 59.55% OVER 4 YEAR PERIOD.
OPERATING PROFIT MARGIN HAS REMAINED SAME AT 10%.
NET PROFIT MARGIN HAS INCREASED FROM 4.3% IN 2005 TO 16% IN 2008 DUE TO DECREASE IN INTEREST OUTGO AND LESSER DEPRECIATION.
INTEREST COVER HAS INCREASED FROM 2.2 IN 2005 TO 16.2 IN 2008.
TOTAL INCOME UP BY 5.83% IN THE Q3FY2009 AS COMPARED TO Q3FY2008.
OPERATING INCOME UP BY 44.23% IN THE Q3FY2009 AS COMPARED TO Q3FY2008.
NET PROFIT UP BY 26% IN THE Q3FY2009 AS COMPARED TO Q3FY2008.
COMPARISION OF Q3FY2009 WITH Q3FY2008:
|
|
31/12/2007 |
% CHG |
31/12/2008 |
TOTAL INCOME |
202.78 |
|
5.83% |
214.62 |
|
EXPENDITURE |
-181.71 |
|
|
-184.23 |
|
OPERATING INCOME |
21.07 |
|
44.23% |
30.39 |
|
DEPRECIATION |
-3.55 |
|
|
-3.86 |
|
PBIT |
|
17.52 |
|
|
26.53 |
|
INTEREST |
|
-0.84 |
|
|
-0.62 |
|
PBT |
|
16.68 |
|
|
25.91 |
|
TAX |
|
-2.66 |
|
|
-8.25 |
|
PAT |
|
14.02 |
|
26% |
17.66 |
|
VALUATION:
At CMP the company seems to be the price catch trading at just 3.8x to FY2009E.We expect higher valuation for the company at 6x.Rational behind is the improving agriculture scenario and emphasis of the government in rural area. We expect the fair price to be Rs560.
Beside this company has some hidden asset like excess land bank and a minority stake in Advinus, one of the pharma research organizations.
Dividend yield on the counter is also good at 4.38%.
CONCLUSION:
Investor with at least one year time horizon could invest on the counter. The downside on the counter is very limited.
Find more Research Reports
Click here for Indian stock market tips
For more details click here
About Us |Site Map| Privacy Policy | Our Partners | Contact Us ||advertise with us |©2005sharetipinfo |