Blog for Stock tips, Equity tips, Commodity tips, Forex tips: Sharetipsinfo.com

Want to beat the stock market volatility? Just keep on reading this exclusive blog by Sharetipsinfo which will cover topics related to stock market, share trading, Indian stock market, commodity trading, equity trading, future and options trading, options trading, nse, bse, mcx, forex and stock tips. Indian stock market traders can get share tips covering cash tips, future tips, commodity tips, nifty tips and option trading tips and forex international traders can get forex signals covering currency signals, shares signals, indices signals and commodity signals.

  UseFul Links:: Stock Market Tips Home | Services | Free Stock / Commodity Trial | Contact Us

Desalination: It is a big money game baby!

http://sharetipsinfo.comJust get registered at Sharetipsinfo and earn positive returns

www.ShareTipsInfo.com

How big is desalination in India?  That is hard to tell because one is confronted with two different sets of numbers.

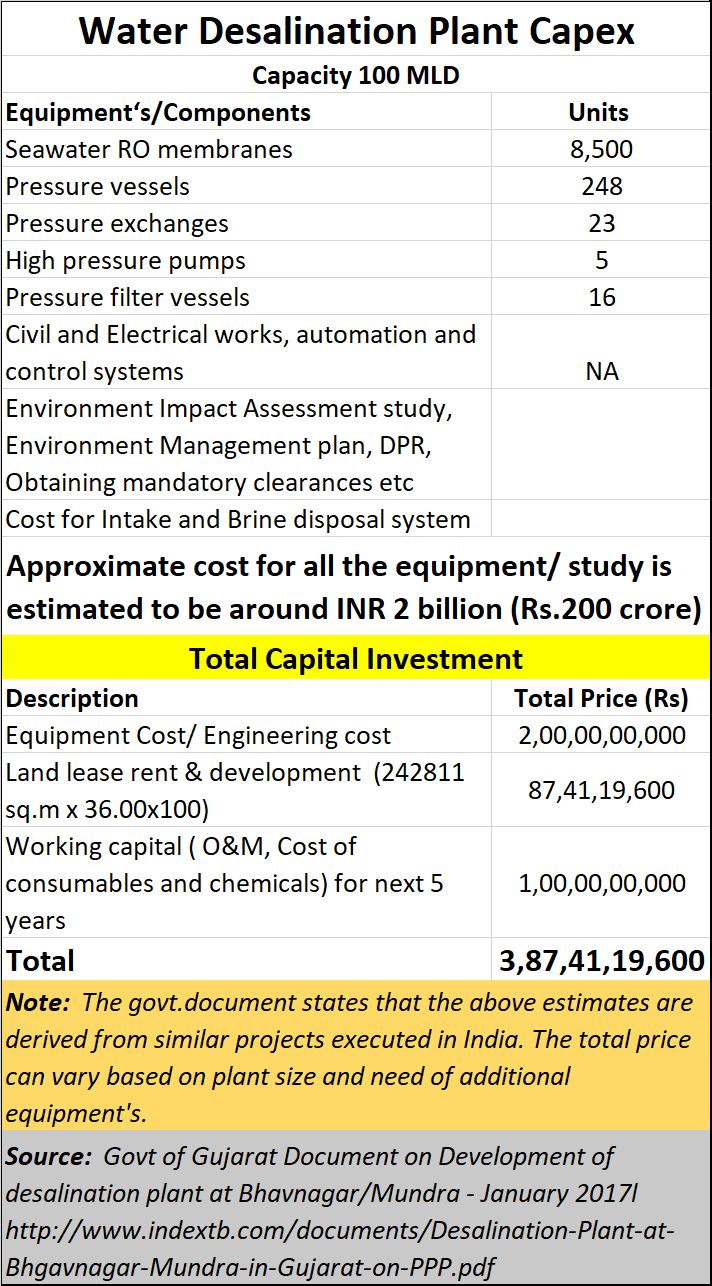
One source is a document prepared by a Gujarat government brochure of 2017 inviting investors to build desalination plants in Bhavnagar and Mundra. It gives out data which many industry players believe is quite credible.  Of course, it must be admitted that ever since the preparation of this document, the ambitions of the state government have grown. The present chief minister talks about his state setting up 10 desalination plants.

Another good source is the Indian Desalination Association.  According to the latter, there could be more than 1,000 membrane-based desalination plants (the more popular technology) of various capacities ranging from 20 m3/day to 10,000 m3/day.

This flies in the face of figures given out by the Gujarat government document -- “As of 2013, India has 182 desalination plants operating majorly in western and southern parts and is expected to increase to over 500 by 2017.”  It is quite possible that the Gujarat government documents only lists large plants, and not experimental or small plants.

However, the government document does confirm that membrane based desalination plants are more popular – around 85% of the plants use this technology which is known to be 23% cheaper than the use of thermal technology. This document also talks about how many big players in India have been eyeing this sector – some names include Nirma, Gujarat Heavy Chemicals and Indian Rayon  -- to meet their captive requirement for water.

Desalination costs:

But why should companies opt for desal water? Simple. Desal water is cheaper than the water provided by the state for chemical process industries.  True, desal water is much more expensive than the natural water states get from aquifers, lakes and rain water that is stored.  But it is much cheaper than the exorbitant price tags state governments like to put on water for business or industrial use, hoping to use the additional money to cross-subsidise free water to vote banks.

In Mumbai, for instance, while the cost of fresh water supplied through pipes is just under 0.8 paise a litre, the price the government wants industry to pay the state charges industries is around Rs.4.8 per cubic metre (1,000 litres) for normal processing industries, but Rs 120 per cubic metre for industries where water itself is a raw material (bottled water, carbonated drinks etc) and for chemical industries. The latter comes to around 12 paise per litre.

This is significantly higher than cost of desal water (inclusive of interest and depreciation, but without including the cost of environmental damage and loss to sea life).

So, how much does desal water cost?

In July 2010, desalination cost around $1 per cubic metre. And given the exchange rate of Rs.50 per dollar then, the cost was 5 paise per litre.  But even then Igal Aisenberg, then CEO and president of Netafim, the world’s largest micro irrigation company did mention how “newer technologies have permitted this cost to come to under half-a-dollar per cubic metre.  We believe that these costs will go down further.”

This is confirmed by a recent (March 8, 2019) report by Bloomberg that the cost of producing one cubic metre of treated water could be around 50 cents. At today’s exchange rate (Rs.70=$1), that would come to around 3.5 paise per litre.

2019-07-27_desalination-costs-capex

A hint of corruption

And this is where one begins to suspect that the hype over desalination could have a lot to do with money.  Two factors point in that direction.

First, there is a lot of money involved in setting up projects for state and central governments.  The Gujarat government estimates the costs to be around Rs.387 crore for a 100 MLD (million litres a day) membrane-based plant  (and this is after capitalisation of five years of working capital requirement). True, there is a caveat that plant costs could vary, there has to be some excellent justification for the varying costs.

Yet, many of the desalination plants set up by private players for governments (they are invariably set up by private players in India) have a higher price tag.  For instance, the price at which Essel Infraprojects wants to set up a 100 mld desalination plant in Gujarat is expected to cost double this sum – Rs. 700 crore. Or consider Tamil Nadu’s plans to set up  two desalination plants at Nemmelli and Minjur, each of 100 MLD capacity, another 400 MLD capacity plant is being set up at Perur. These plants too are at significantly higher costs.  According to one media report, each 10 MLD desalination plant in “would cost around Rs 140 crore. The three plants will cost over Rs 420 crore.”

2019-07-27_desalination-costs

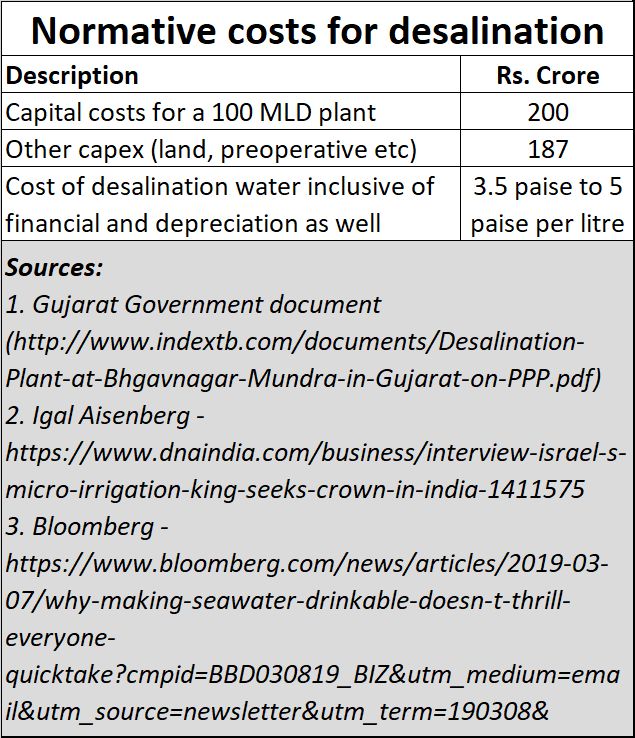
And the price at which Tamil Nadu procures desalinated water is well over 10 paise a litre compared to the cost of 3.5 to 5 paise a litre.  A five paise difference translates into Rs.50 lakh a day for a 100 MLD plant.  That translates into Rs.182 crore each year for each 100 MLD plant.  As the procurement prices increase, the numbers grow uncomfortably larger too.  When multiplied into the number of plants, the sums could be scandalous

Significantly, the Niti Aayog proposal mentions neither normative capital costs nor normative pricing for desal water.  As a think tank it should have done that as well.

In brief

Niti Aayog should have made a case for better metering, working out consumption estimates, making a case for preventing contamination of existing freshwater sources – rivers, ponds, lakes, the sea and even ground water.  It should have talked about ways to harvest water on a public-private-partnership basis. It ought to have made a case for pricing of water in a sensible but sustainable manner.

As had been pointed out by Madhav Gadgil in his report on environment in the Western Ghats of India, there are times when unscrupulous industrialists try to conceal effluent discharge by pumping it into the ground.  There are instances of the Central Pollution Control Board (CPCB) and its state affiliates actually ignoring enforcement of a zero discharge policy for all highly polluting companies. Niti Aayog should have put up a note on how to strengthen monitoring mechanisms – even using third-party inspections by reputed global organisations like the SGS.

That would have given India more water than all the proposed desalination plants.

Instead of doing this, it is sad to see a body like Niti Aayog actually advocating a disastrous policy of putting up desalination plants along the country’s coastline. Such a move will destroy environment, livelihoods of fisherfolk, and burden India with a huge import cost. It will divert the attention of policymakers away from the actual things that need to be done.

GBP/USD Daily Forecast – Range Emerges as Dollar Weakens

http://sharetipsinfo.comJust get registered at Sharetipsinfo and earn positive returns

www.ShareTipsInfo.com

After a sharp drop early last week, GBP/USD has fallen into a range while the dollar eases lower.

GBP/USD Consolidates Losses

If there was a clear theme in July for the FX markets, it was that the British Pound was weak. Although Sterling has been able to hold the downside a bit over the past few sessions, there is no reason to believe this theme has not carried over into August.

A weaker dollar over the past few sessions has triggered a range in GBP/USD. This is not all that surprising after the sharp earlier fall in the pair. However, while the technical outlook for EUR/USD shows that that the near-term trend has shifted upwards, GBP/USD does not share the same bullish sentiment.

The pair has been weighed by concerns over a no-deal Brexit as the new Prime Minister has not convinced UK citizens that he can pull off an exit with a deal in place. He has vowed to leave the European Union whether a deal is made or not which has caused the markets to reprice Sterling.

For this reason, I don’t expect that GBP/USD is trying to carve out a bottom here. Unless there are some developments that will boost confidence that a deal will be made, I think the natural course for the pair is lower.

Technical Analysis

I think it is important to keep in mind that there is significant support in play here. On the chart below, I have marked it off at 1.2150. However, I think we can extend a bit below the level even as it was around this area that GBP/USD bottomed in late 2016 to early 2017.

Because of the underlying support, and as the dollar as trending lower, I think GBP/USD will try to move to upper bound of the current range. I think it’s possible the pair attempts to break higher from the range. But as mentioned, I don’t think a catalyst is in place for the pair to bottom here.

Resistance has come into play from the 100 moving average on an hourly chart. If the pair pushes through it, I expect it will attempt to trigger stops above Friday’s high of 1.2188.

Get Forex Signals with high accuracy


A coincidence is helping Indian banks tame NPAs, not for the first time

http://sharetipsinfo.comJust get registered at Sharetipsinfo and earn positive returns

www.ShareTipsInfo.com

A swift bond rally triggered by a fall in interest rates and a fiscally-responsible Budget has come to the rescue of beleaguered Indian banks, which are in the throes of a deleveraging cycle.

India's 10-year bond yield have fallen over 150 basis points from their highest point this year.

Bond yields and prices are inversely correlated as a fall in yields makes older bonds yielding higher interest rates more attractive.

So investors holding bonds in a falling-yield environment see a notional gain. For banks, this means that bad loans become smaller as a proportion in an overall book that has been repriced higher.

The fall in bond yields, combined with a generous Rs 70,000-crore cash infusion by the government, would help exacerbate pressure on Indian banks, which are battling their worst NPA crisis in two decades.

Every basis point fall in bond yields benefit banks by an overall $50 million, given the size of their portfolio, an Economic Times article quoting an estimate by ICRA said.

The bond rally has been further bolstered by India's proposal last month to issue its first overseas bond.

Further, the Reserve Bank of India’s (RBI) rate-cutting panel will again meet on August 7 to decide policy rates.

India is among few countries with an investment-grade rating to offer yields of more than 5 percent, Manu George, director of fixed income at Schroder Investment Management Ltd. in Singapore, told Mint. “Indian bonds offer good value in a low-yielding world and have the potential to rally further."

In a recent interview, Romesh Sobti, chief executive officer at IndusInd Bank, pointed out that even in 2002, around the time the NPA cycle peaked out, it was a fall in bond yields that had come to the rescue of banks.

Hence, this is not the first time that a strong bond rally helped in dealing with the bad debt hovering over India’s financial system.

“While this time around the drop in the sovereign bond yields is not as dramatic, the quantum of bond holding is way higher,” Sobti said in the interview. “Gains will be handsome enough to enable banks to start cleaning up the books faster."

AUD/USD at the Possible Fragile 0.6800 Support

http://sharetipsinfo.comJust get registered at Sharetipsinfo and earn positive returns

www.ShareTipsInfo.com

Long-term perspective

The steep decline that came after the confirmation of the double resistance etched by the upper line of the descending channel and the 0.7055 with 0.7013 resistance area managed to bring the price under the 0.6858 major support level, pausing at the 0.6800 psychological level.

This movement, besides taking out the previous low that falsely pierced the 0.6858 level, is composed of strong bearish candles — the only one which does not have a long body, although is bearish, is the one on July 29, 2019, the reason being that the bulls were trying to halt the decline around an important psychological level, 0.6800, respectively.

From here, the price could consolidate above 0.6800 and then continue the downwards movement. Another possibility is the one of a throwback. In this case, the price might retrace towards 0.6858. This could end up with the actual confirmation of 0.6858 as a resistance, followed by a new leg down. Another possible scenario is a confirmation as a resistance of the projection of the 0.6831 low. Also to be considered is a false break of 0.6858 — the price might get above it but fail to confirm it as a support, with the consequent fall beneath it and the continuation of the decline.

So, as long as the price does not confirm 0.6858 as support, the movement towards south is natural, being the materialization of the impulsive wave that pertains to the descending trend. A first target is represented by 0.6700, with a possible extension on the first run to 0.6650.

Short-term perspective

The price is in a clear descending movement and, as long as it continues or as long as its change prints a continuation pattern, it is expected to continue.

The first sign of a pause could be offered if the price gets above the 0.6865 level — which corresponds to the 23.6 level of Fibonacci retracement. But even in this case the other projections — preferably up to 50.0, which corresponds to the 0.6935 level — are well suited short-term areas from where the price to continue declining. The first target is represented by the 0.6700 psychological level.

Australian Dollar Suffers from Risk Aversion

http://sharetipsinfo.comJust get registered at Sharetipsinfo and earn positive returns

www.ShareTipsInfo.com

The Australian dollar tumbled today. While macroeconomic data, both domestic and from China, was not particularly bad, risk aversion on the Forex market hurt the Australian currency.

The Australian Industry Group Australian Performance of Manufacturing Index climbed to 51.3 in July from 49.4 in June. Climbing above the 50.0 level, the indicator suggests that the sector returned to expansion.

The import price index rose 0.9% in the June quarter from the previous three months, two times less than analysts had predicted — 1.8%. The index fell 0.5% in the previous quarter.

The Index of the Commodity Prices rose 16.1% in July from a year ago. The index increased by 13.9% in June.

The Caixin China Manufacturing PMI was at 49.9 in July, up from 49.4 in June. It was above the level of 49.6 predicted by analysts and just a notch below the 50.0 level of no change.

But risk aversion caused by a tweet of US President Donald Trump about new tariffs on Chinese goods did not allow the Aussie to profit from the relatively positive macroeconomic releases. The news was negative for riskier currencies in general, but especially for those of China’s trading partners, including the Australian dollar.

AUD/USD dropped from 0.6843 to 0.6805 as of 20:16 GMT today. EUR/AUD jumped from 1.6176 to 1.6295. AUD/JPY plunged from 74.42 to 73.09

Earlier News About the Australian Dollar:

  • AUD/CAD Looking for 0.9000 (2019-07-29)
  • Australian Dollar Falls After PMI Releases (2019-07-24)
  • AUD/USD Not Ready Yet for 0.7200 (2019-07-24)
  • AUD/USD Facing an Important Test Before Continuing Towards 0.7200 (2019-07-18)
  • Weak Employment Data Doesn't Prevent Rally of Australian Dollar (2019-07-18)

Forex - Dollar Down vs Havens, Up vs High-Yielders on Tariff News

http://sharetipsinfo.comJust get registered at Sharetipsinfo and earn positive returns

www.ShareTipsInfo.com

 The dollar fell against safe havens such as the yen and Swiss francin early trading in Europe Friday, but was higher against most other currencies after President Donald Trump announced a sharp escalation of the U.S.’s trade war with China.

The yen had its best day against the dollar in two years on Thursday after the announcement of a new 10% tariff on $300 billion worth of imports from China. By 3 AM ET (0700 GMT), it was at 106.95 to the dollar, having risen to its highest since April 2018 against the greenback earlier.

The dollar was also lower against the franc at 0.9880, as traders unwound carry trades in a broad risk-off move across all markets.

Trump’s announcement shattered a fragile truce with China over trade that had been hastily put in place ahead of the G20 summit a month ago. It represents a sharp escalation of the conflict, by extending tariffs to effectively all U.S. imports from China. As such, the risk of them feeding through to higher prices for U.S. consumers is markedly higher.

Analysts from the Peterson Institute in Washington estimated that the move will raise the average tariff on Chinese products to 21.5%, from barely 3% in 2017 when Trump took power.

Trump’s move came only a day after Federal Reserve chairman Jerome Powell had pointed to the trade dispute as the biggest single risk facing the U.S. and global economies – observations that drew criticism from Trump show said that Powell had “let us down.”

“Ironically the Fed’s easing gives the President the breathing space to now play hard ball,” Megan Greene, a senior fellow at the Harvard Kennedy School, said via Twitter.

The dollar surged against high-yielders overnight, hitting a 10-year high against the Aussie and rising sharply against the Korean won and kiwi. It also surged 1% against the offshore Chinese yuan, although China’s central bank restrained the drop in the official rate.

The impact on the euro and British pound was less severe, although reports that Trump may make an announcement on trade with the EU later Friday added to the general sense of unease.

The dollar index, which tracks the greenback against a basket of currencies, hit its highest level since May 2017 at 98.697 overnight, before retracing to 98.105 in European trading.

The escalation of the trade war threatens to overshadow what would normally be the main event of the monthly economic calendar – the release of the U.S. labor market report for July. Nonfarm payroll growth is expected to have slowed to 160,000 from 224,000 in June.

Get Forex Signals with high accuracy


Inflation Report August 2019

http://sharetipsinfo.comJust get registered at Sharetipsinfo and earn positive returns

www.ShareTipsInfo.com

In order to maintain price stability, the Government has set the Bank’s Monetary Policy Committee (MPC) a target for the annual inflation rate of the Consumer Prices Index of 2%. Subject to that, the MPC is also required to support the Government’s economic policy, including its objectives for growth and employment. The Inflation Report is produced quarterly by Bank staff under the guidance of the members of the Monetary Policy Committee. It serves two purposes. First, its preparation provides a comprehensive and forward-looking framework for discussion among MPC members as an aid to our decision-making. Second, its publication allows us to share our thinking and explain the reasons for our decisions to those whom they affect. Although not every member will agree with every assumption on which our projections are based, the fan charts represent the MPC’s best collective judgement about the most likely paths for inflation, output and unemployment, as well as the uncertainties surrounding those central projections. This Report has been prepared and published by the Bank of England in accordance with section 18 of the Bank of England Act 1998. The Monetary Policy Committee: Mark Carney, Governor Ben Broadbent, Deputy Governor responsible for monetary policy Jon Cunliffe, Deputy Governor responsible for financial stability Dave Ramsden, Deputy Governor responsible for markets and banking Andrew Haldane Jonathan Haskel Michael Saunders Silvana Tenreyro Gertjan Vlieghe

Get Forextips With High Accuracy

Get Ready for a Weaker U.S. Dollar... And Stronger Gold

http://sharetipsinfo.comJust get registered at Sharetipsinfo and earn positive returns

www.ShareTipsInfo.com

Unemployment in the U.S. is at a half-century low and the S&P 500 is trading at near-record highs. Nevertheless, the Federal Reserve today trimmed interest rates for the first time since the financial crisis on stalled manufacturing growth and an anticipated world economic slowdown.

The easing cycle may be the catalyst gold needs to outperform the market and retrace its monster bull rally in the 2000s, according to Bloomberg Intelligence strategist Mike McGlone.

“Gold prices appear on a similar launchpad as 2001 when the Fed began an easing cycle,” McGlone writes in a note dated July 29. “The greatest bull market of this millennium so far began about the time of that first rate cut, following an extended gold-price downdraft and rally in the dollar.”

With the Fed having locked in a rate cut, the question now is: What happens in the months to come? Is this simply a one-off, or is it indeed the start of a new easing cycle?

Markets appear to have priced in three cuts by year-end. As a result, I would expect to see the dollar trade lower, which in turn should allow the price of gold—the classic anti-dollar—to soar.

As I shared with you earlier in the month, a weaker greenback is one of three “key ingredients” for a gold bull market, according to research firm Alpine Macro, the other two being a more accommodative Fed (check) and rising geopolitical risk

As Europe faces prospects that negative rates might become a long-term fixture in the euro region, concerns are mounting in the U.S. that a global slide toward negative yields could infect the market for Treasury securities, should the U.S. slip into a recession,” writes Guggenheim Investments Chief Investment Officer Scott Minerd. “These concerns are well founded.”

Minerd reminds readers that, during economic slowdowns in the past, the Fed reduced rates by an average of 5.5 percentage points. Today, as you well know, we don’t have those 5.5 percentage points—unless rates were allowed to fall below zero.

Yields turning negative here in the U.S., as they have in Europe, Japan and elsewhere, would mark the start of a “paradigm shift” that billionaire hedge fund manager Ray Dalio alluded to in a recent LinkedIn post.

According to Dalio, lower-for-longer rates and other unorthodox monetary policies “will produce more negative real and nominal returns that will lead investors to increasingly prefer alternative forms of money (e.g., gold) or other storeholds of wealth.”

Get Live Forex Signals

US Dollar Rallies on Better-Than-Expected Q2 GDP

http://sharetipsinfo.comJust get registered at Sharetipsinfo and earn positive returns

www.ShareTipsInfo.com

The US dollar is rallying against a basket of currencies to close out the trading week, driven by a better-than-expected but slower than usual second-quarter economic report. The gross domestic product cooled down in the April-to-June period, but there were some bright spots in the overall report, including a surge in consumer spending.

According to the Bureau of Economic Analysis (BEA), the gross domestic product advanced a 2.1% annual clip in the second quarter, down from 3.1% in the first three months of 2019. This was higher than the market forecast of 1.9%.

Despite the disappointment behind the report, a deep dive into the numbers do paint somewhat of a positive portrait of the US economy from a consumer standpoint. In the April-to-June period, consumer spending surged 4.3%, driven by greater automobile, food, and apparel purchases. But it was not good news for businesses because fixed investment slipped 0.8%, investment dropped 11%, spending on equipment edged up just 1%, and outlays fell 1.5%.

Researchers say that if inventories would have remained neutral instead of declining $44.3 billion, then the economy would have expanded at a 3% rate in the second quarter.

Elsewhere in the report, the trade deficit impacted GDP as imports decreased and exports soared 5.2%. Federal government spending spiked 5%. Inflation, using the Personal Consumption Expenditures (PCE) index, clocked in at a 1.4% pace year over year. 

Researchers say that if inventories would have remained neutral instead of declining $44.3 billion, then the economy would have expanded at a 3% rate in the second quarter.

Elsewhere in the report, the trade deficit impacted GDP as imports decreased and exports soared 5.2%. Federal government spending spiked 5%. Inflation, using the Personal Consumption Expenditures (PCE) index, clocked in at a 1.4% pace year over year.

Since Federal Reserve officials have made public their concern about a potential slowdown, the latest economic figures could push the Eccles Building to impose a 25-basis-point cut to interest rates from the current target range of 2.25% to 2.50%. More than half the market anticipates two rate cuts this year, according to the CME Group FedWatch tool.

Although this report does suggest that the US economy might expand more slowly in the second half of 2019, some financial institutions believe that this is just a slight bump in the road. Goldman Sachs is prognosticating that growth will return to normal in the second half.

Get 100% VIP Signals now

India's January-July coffee exports flat at 2.38 lakh tonnes

http://sharetipsinfo.comJust get registered at Sharetipsinfo and earn positive returns

www.ShareTipsInfo.com

Coffee shipments from India, Asia's third-largest producer and exporter, remained flat at 2,38,669 tonnes so far this calendar year with maximum shipments made to Italy, as per the Coffee Board.

The country had shipped 2,37,780 tonnes of coffee bean during January-July in the previous year, its data showed.

India exports large volumes of Robusta variety of coffee bean, followed by Arabica and instant coffee.

According to the board, export of Robusta coffee rose to 1,35,892 tonnes till July 2019, from 1,26,254 tonnes in the year-ago period.

Arabica coffee shipments, however, declined to 37,609 tonnes from 40,795 tonnes in the said period.

Even shipment of instant coffee showed a decline as volumes dropped to 12,504 tonnes during January-July of this calendar year from 16,303 tonnes in the same period in 2018.

Re-export of coffee was also slightly down at 52,513 tonnes from 54,222 tonnes in the period under review.

Of the total exports, more than 55,000 tonnes of coffee is estimated to have been shipped to Italy, followed by over 25,000 tonnes to Germany and about 16,000 tonnes to Russian Federation.

The country's coffee output is pegged at 3,19,500 tonnes for the 2018-19 marketing year (October-November), as against 3,16,000 tonnes in the previous marketing year.

  UseFul Links:: Stock Market Tips Home | Services | Free Stock / Commodity Trial | Contact Us